Lab03_WriteUp
Contents
Question 1
Question 1a
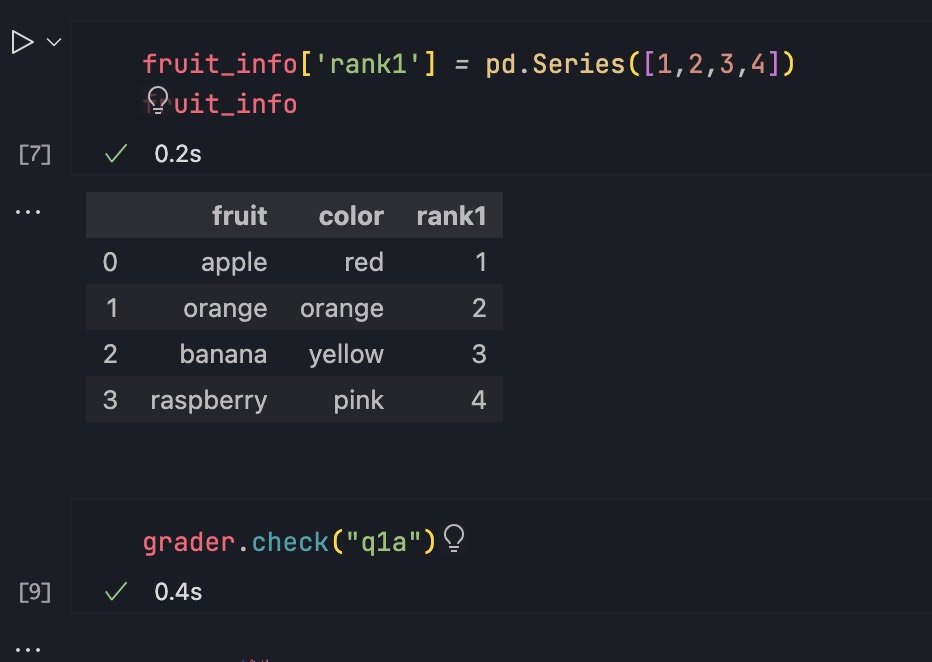
For a DataFrame d, you can add a column with d['new column name'] = ... and assign a list or array of values to the column. Add a column of integers containing 1, 2, 3, and 4 called rank1 to the fruit_info table which expresses your personal preference about the taste ordering for each fruit (1 is tastiest; 4 is least tasty).
Question 1b
You can also add a column to d with d.loc[:, 'new column name'] = .... As discussed in lecture, the first parameter is for the rows and second is for columns. The : means change all rows and the new column name indicates the column you are modifying (or in this case, adding).
Add a column called rank2 to the fruit_info table which contains the same values in the same order as the rank1 column.
| |
Question 2
Use the .drop() method to drop both the rank1 and rank2 columns you created. (Make sure to use the axis parameter correctly.) Note that drop does not change a table, but instead returns a new table with fewer columns or rows unless you set the optional inplace parameter.
Hint: Look through the documentation to see how you can drop multiple columns of a Pandas dataframe at once using a list of column names.
| |
Question 3
Use the .rename() method to rename the columns of fruit_info_original so they begin with capital letters. Set this new dataframe to fruit_info_caps.
| |
Question 4
Selecting multiple columns is easy. You just need to supply a list of column names. Select the Name and Year in that order from the baby_names table.
| |
Question 5
Using a boolean array, select the names in Year 2000 (from baby_names) that have larger than 3000 counts. Keep all columns from the original baby_names dataframe.
Note: Any time you use p & q to filter the dataframe, make sure to use df[(df[p]) & (df[q])] or df.loc[(df[p]) & (df[q])]. That is, make sure to wrap conditions with parentheses.
Remember that both slicing and loc will achieve the same result, it is just that loc is typically faster in production. You are free to use whichever one you would like.
| |
Optionally, repeat the exercise from above, but this time using the query command from lecture.
| |
Question 6
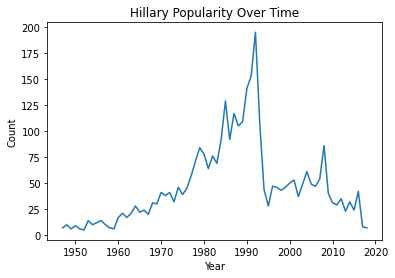
Some names gain/lose popularity because of cultural phenomena such as a political figure coming to power. Below, we plot the popularity of the female name Hillary in Calfiornia over time. What do you notice about this plot? What might be the cause of the steep drop?
| |